 ar
ar bg
bg hr
hr cs
cs da
da nl
nl fi
fi fr
fr de
de el
el hi
hi it
it ko
ko no
no pl
pl pt
pt ro
ro ru
ru es
es sv
sv tl
tl iw
iw id
id lv
lv lt
lt sr
sr sk
sk sl
sl uk
uk vi
vi et
et hu
hu th
th tr
tr fa
fa ms
ms hy
hy ka
ka ur
ur bn
bn mn
mn ta
ta kk
kk uz
uz ku
ku
Daisy-Chained Digital Thermometer
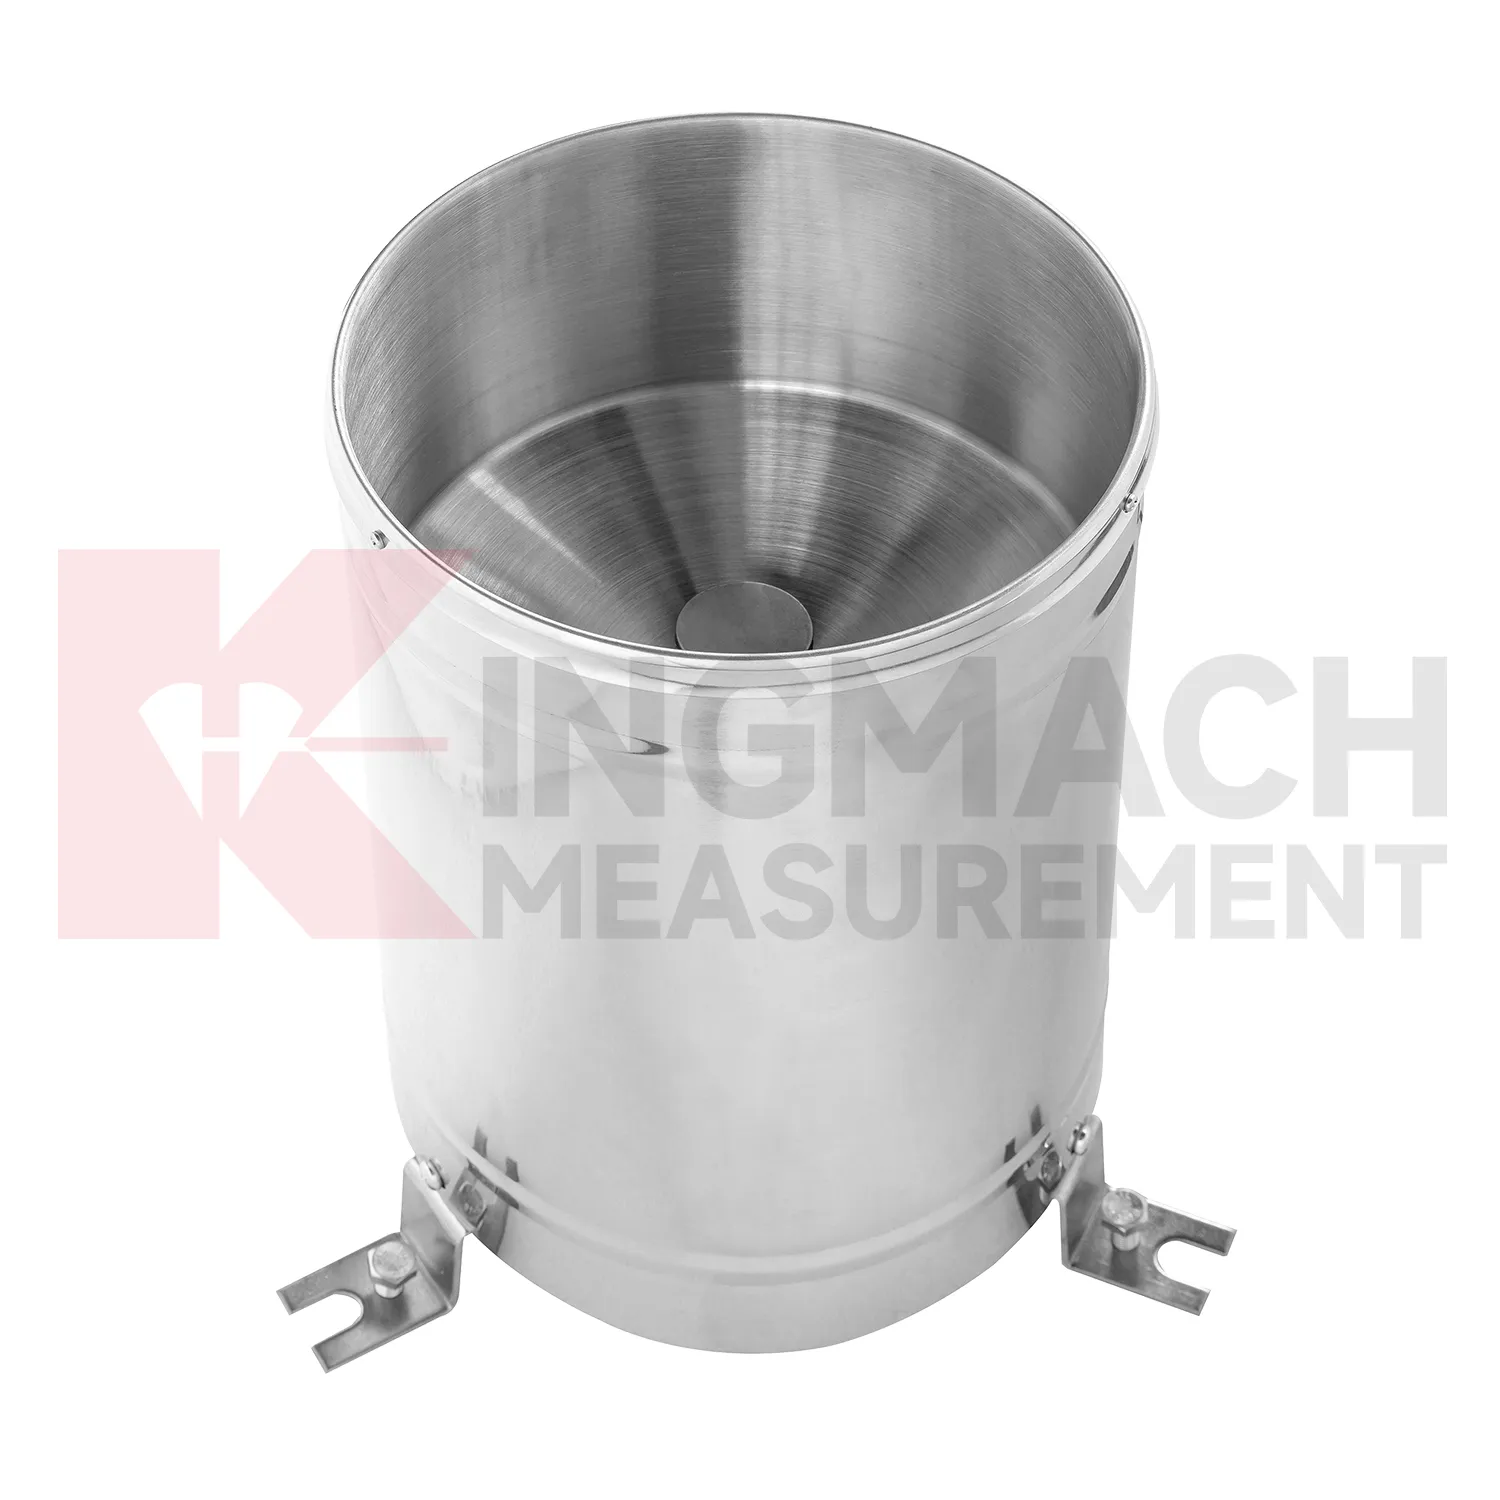
Rainfall monitoring in Kingmach Daisy-Chained Digital Thermometer provides the time record behind many water-related engineering events. A rain point should be open to the sky, level, clean, and protected from splash, leaves, dust, and nearby obstructions. The data is useful because it turns a storm into a dated sequence that can be compared with slope movement, seepage, runoff, settlement, pore pressure, tunnel leakage, or construction delays. Long-term rainfall records also help owners understand seasonal behavior. A small storm after many wet days may create more response than a larger storm after dry weather. A well-maintained rainfall record helps explain that difference. For reports, the most useful information is not only the total rain amount, but also timing, duration, intensity pattern, and whether related ground or structural sensors changed afterward.
During abnormal events, the first question is not only whether the value crossed a limit. The reviewer should ask what changed around the site, whether the related structure reacted, and whether a field inspection confirmed the same pattern.
Long-term value comes from consistency. A channel that keeps the same location, unit, maintenance history, and linked asset record can support seasonal comparison, post-storm review, and handover between construction and operation teams.
Maintenance teams should record cleaning, access difficulty, enclosure condition, cable repair, vegetation growth, nearby equipment changes, and the first normal reading after work. Those notes protect the meaning of the curve when old data is reviewed months later.
Application of Daisy-Chained Digital Thermometer
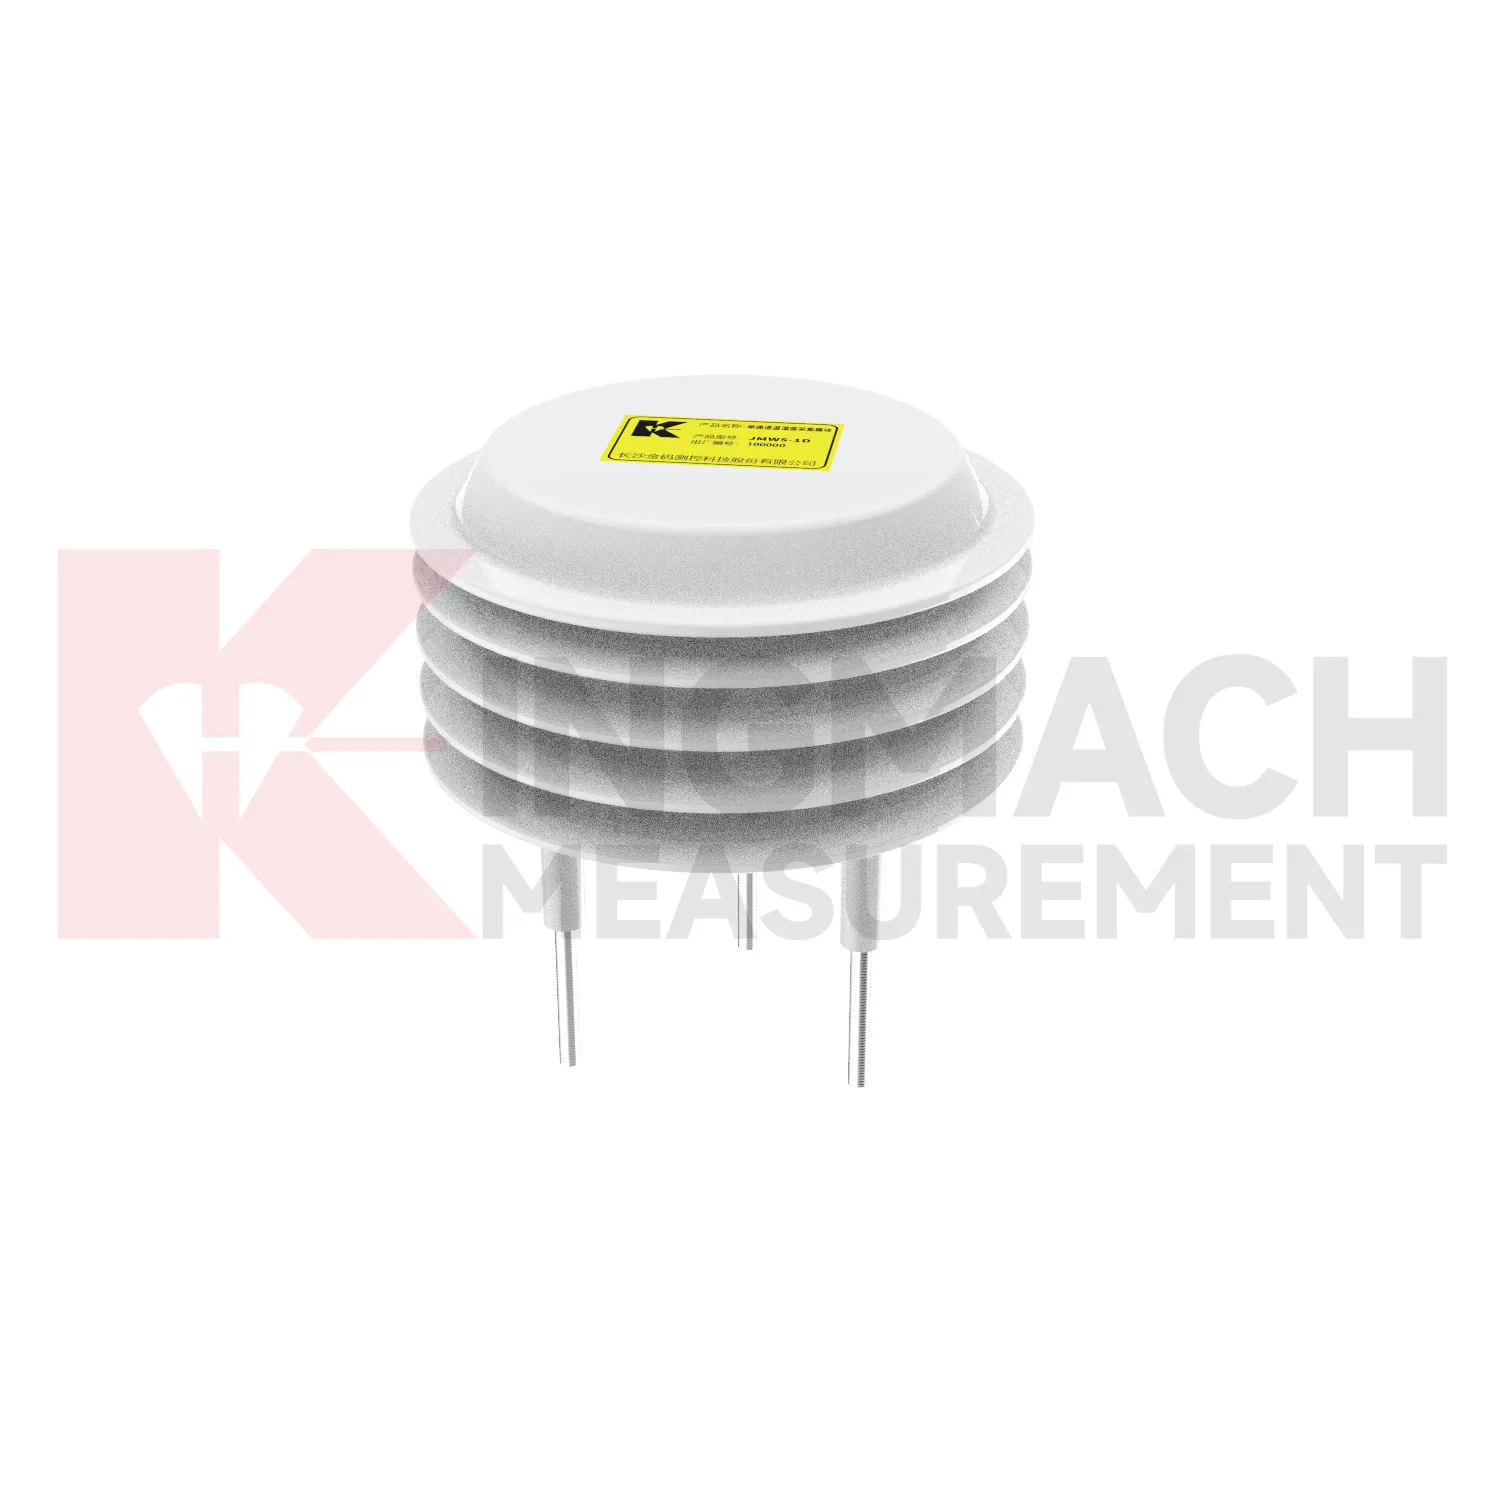
Agriculture and irrigation projects use Kingmach Daisy-Chained Digital Thermometer to understand the relation between rainfall, irrigation, soil wetness, air conditions, and plant or ground response. The purpose is not just to display weather information. The record should help managers decide when soil is drying, whether irrigation reached the intended depth, whether rainfall replaced a scheduled watering event, and how greenhouse or field conditions changed over time. Probe depth, soil type, crop zone, irrigation schedule, and cable route should be recorded at installation. Air temperature and humidity can be reviewed with soil wetness to understand drying speed and growing conditions. A consistent environmental record supports practical water management and helps avoid decisions based only on surface appearance.
Maintenance teams should record cleaning, access difficulty, enclosure condition, cable repair, vegetation growth, nearby equipment changes, and the first normal reading after work. Those notes protect the meaning of the curve when old data is reviewed months later.
The environmental point should be part of a named monitoring question. It may explain wetting, drying, wind exposure, thermal movement, cabinet stress, or pressure variation, but that purpose needs to be visible in drawings and reports.
If the reading seems unusual, the team should check the physical condition of the station before drawing conclusions about the asset. Blockage, poor exposure, loose wiring, water entry, and changed surroundings can all create misleading patterns.
The future of Daisy-Chained Digital Thermometer
Climate exposure will influence future Kingmach Daisy-Chained Digital Thermometer requirements. Infrastructure owners increasingly face heat, heavy rain, high humidity, strong wind, ice, corrosion, and rapid weather changes. Monitoring stations must remain useful through those conditions, not only measure them. Future specifications should pay attention to enclosure access, cleaning needs, cable aging, connector protection, mounting stability, and weather-event history. Long-term records can help owners see whether repeated exposure affects an asset or the monitoring station itself. The future of environmental measurement is therefore both about recording the environment and keeping the record reliable while the environment is harsh.
If the reading seems unusual, the team should check the physical condition of the station before drawing conclusions about the asset. Blockage, poor exposure, loose wiring, water entry, and changed surroundings can all create misleading patterns.
A practical report links the condition value with time, place, and action. It should help a reviewer decide whether to keep observing, inspect the field point, compare nearby instruments, or record the event as normal site behavior.
Care & Maintenance of Daisy-Chained Digital Thermometer
Rainfall maintenance for Kingmach Daisy-Chained Digital Thermometer should focus on keeping the catchment path clean and level. Leaves, dust, insects, scale, bird droppings, splash, and tilted mounting can distort rainfall records. The rain point should be inspected after storms, long dry periods, nearby earthwork, and seasonal debris build-up. Cleaning should be logged with date, condition, leveling status, and the first normal reading after work. Rainfall data is often used to explain slope movement, seepage, tunnel leakage, construction delay, or drainage performance. If the rain record is wrong, the engineering interpretation may also be wrong. Simple field care protects a much larger monitoring decision.
Maintenance teams should record cleaning, access difficulty, enclosure condition, cable repair, vegetation growth, nearby equipment changes, and the first normal reading after work. Those notes protect the meaning of the curve when old data is reviewed months later.
The environmental point should be part of a named monitoring question. It may explain wetting, drying, wind exposure, thermal movement, cabinet stress, or pressure variation, but that purpose needs to be visible in drawings and reports.
Kingmach Daisy-Chained Digital Thermometer
Rainfall records are a central part of Kingmach Daisy-Chained Digital Thermometer for slopes, embankments, dams, tunnel portals, and construction sites. Rain does not always cause immediate movement; water may enter the ground, raise pore pressure, soften material, or change runoff over time. That delay is exactly why a dated rainfall record matters. Engineers can compare the storm start, rainfall duration, peak intensity, soil response, and movement curve. Without that record, a slope alarm may be discussed as a vague weather event. With it, the team can see whether movement followed the storm, whether it continued after rain stopped, and whether field inspection is needed. Rain data becomes part of the engineering timeline rather than a background note.
The environmental point should be part of a named monitoring question. It may explain wetting, drying, wind exposure, thermal movement, cabinet stress, or pressure variation, but that purpose needs to be visible in drawings and reports.
If the reading seems unusual, the team should check the physical condition of the station before drawing conclusions about the asset. Blockage, poor exposure, loose wiring, water entry, and changed surroundings can all create misleading patterns.
FAQ
Q: How does rainfall data support slope review?
A: Rainfall gives the timing and intensity background for movement, seepage, wetting, and field inspections after storms.
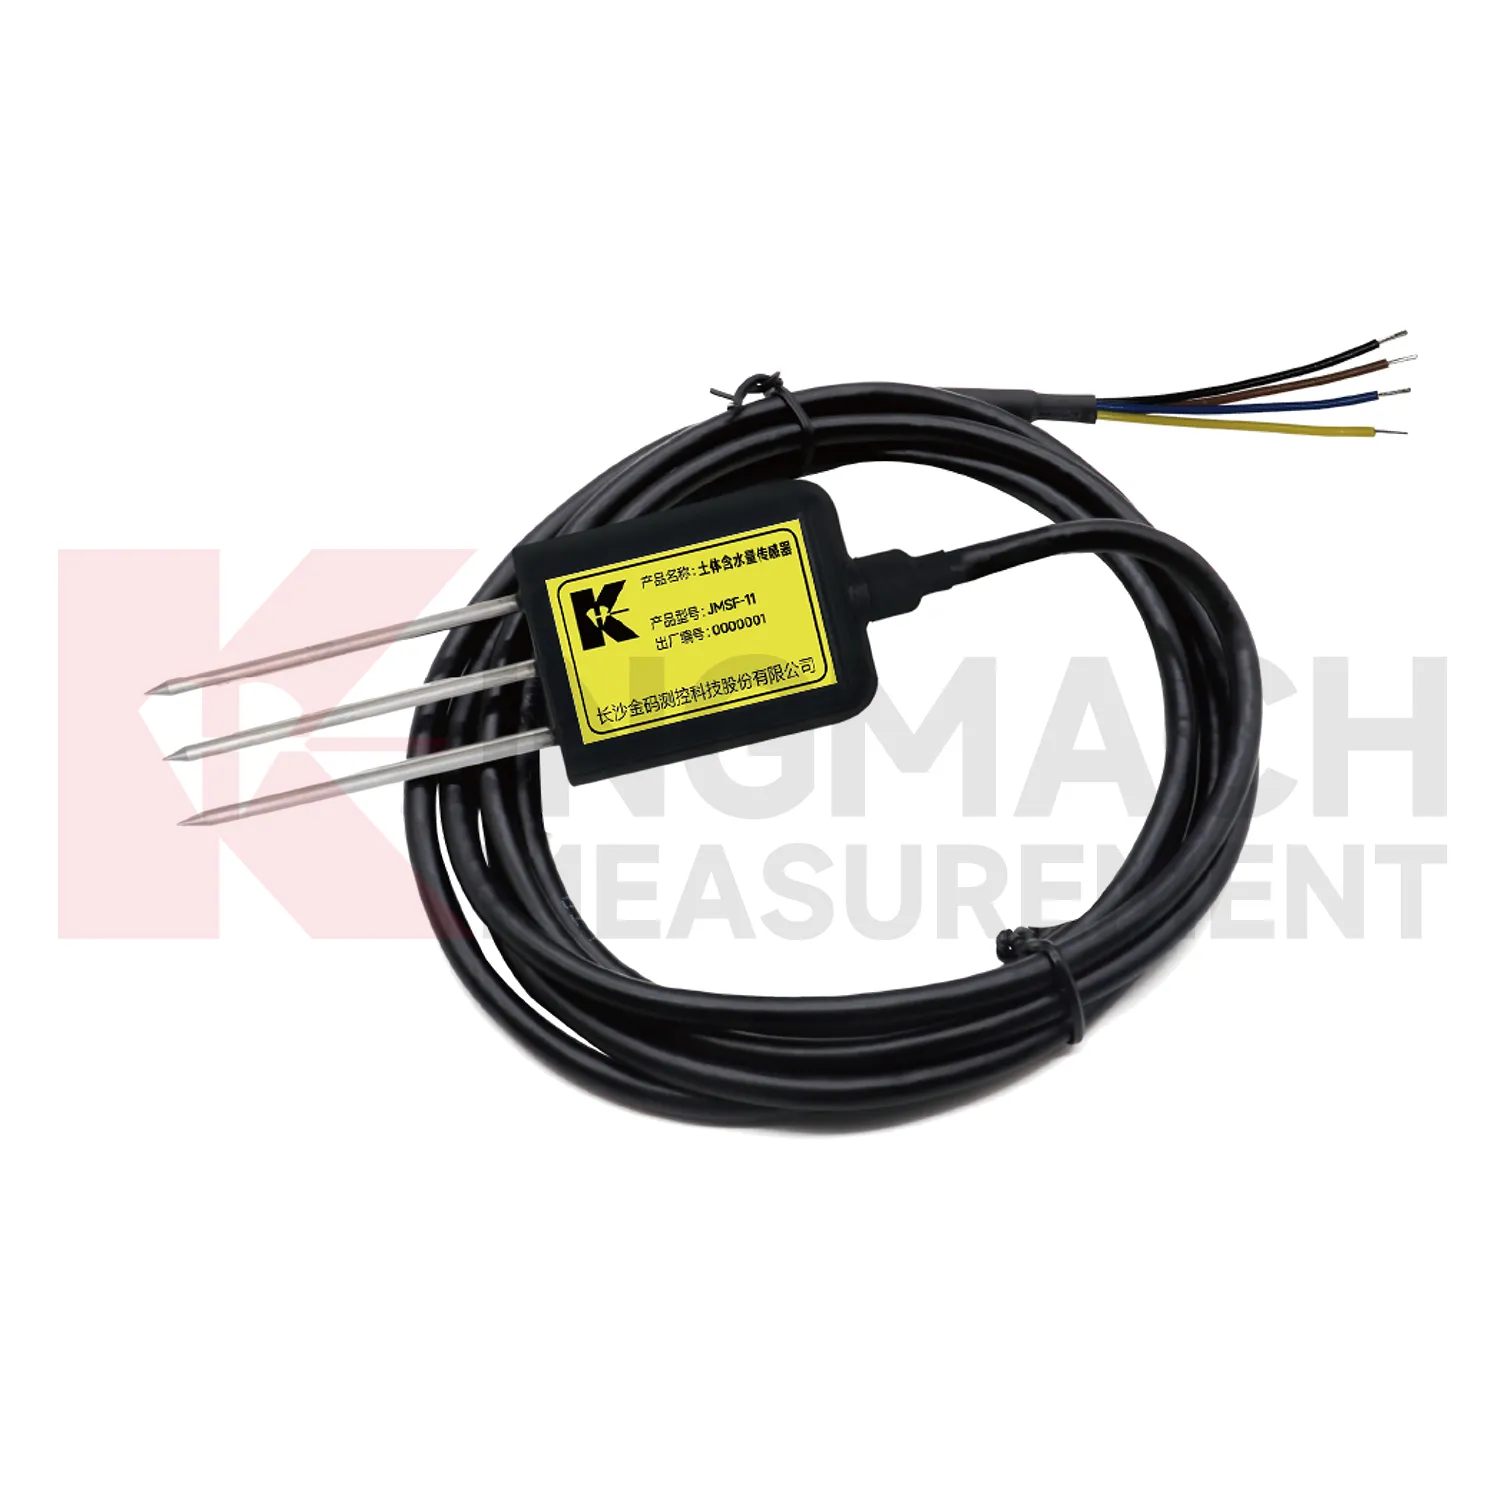
Q: Why measure soil wetness as well as rainfall?
A: Rainfall stays at the surface record, while buried wetness shows whether water reached the soil depth that may influence movement.
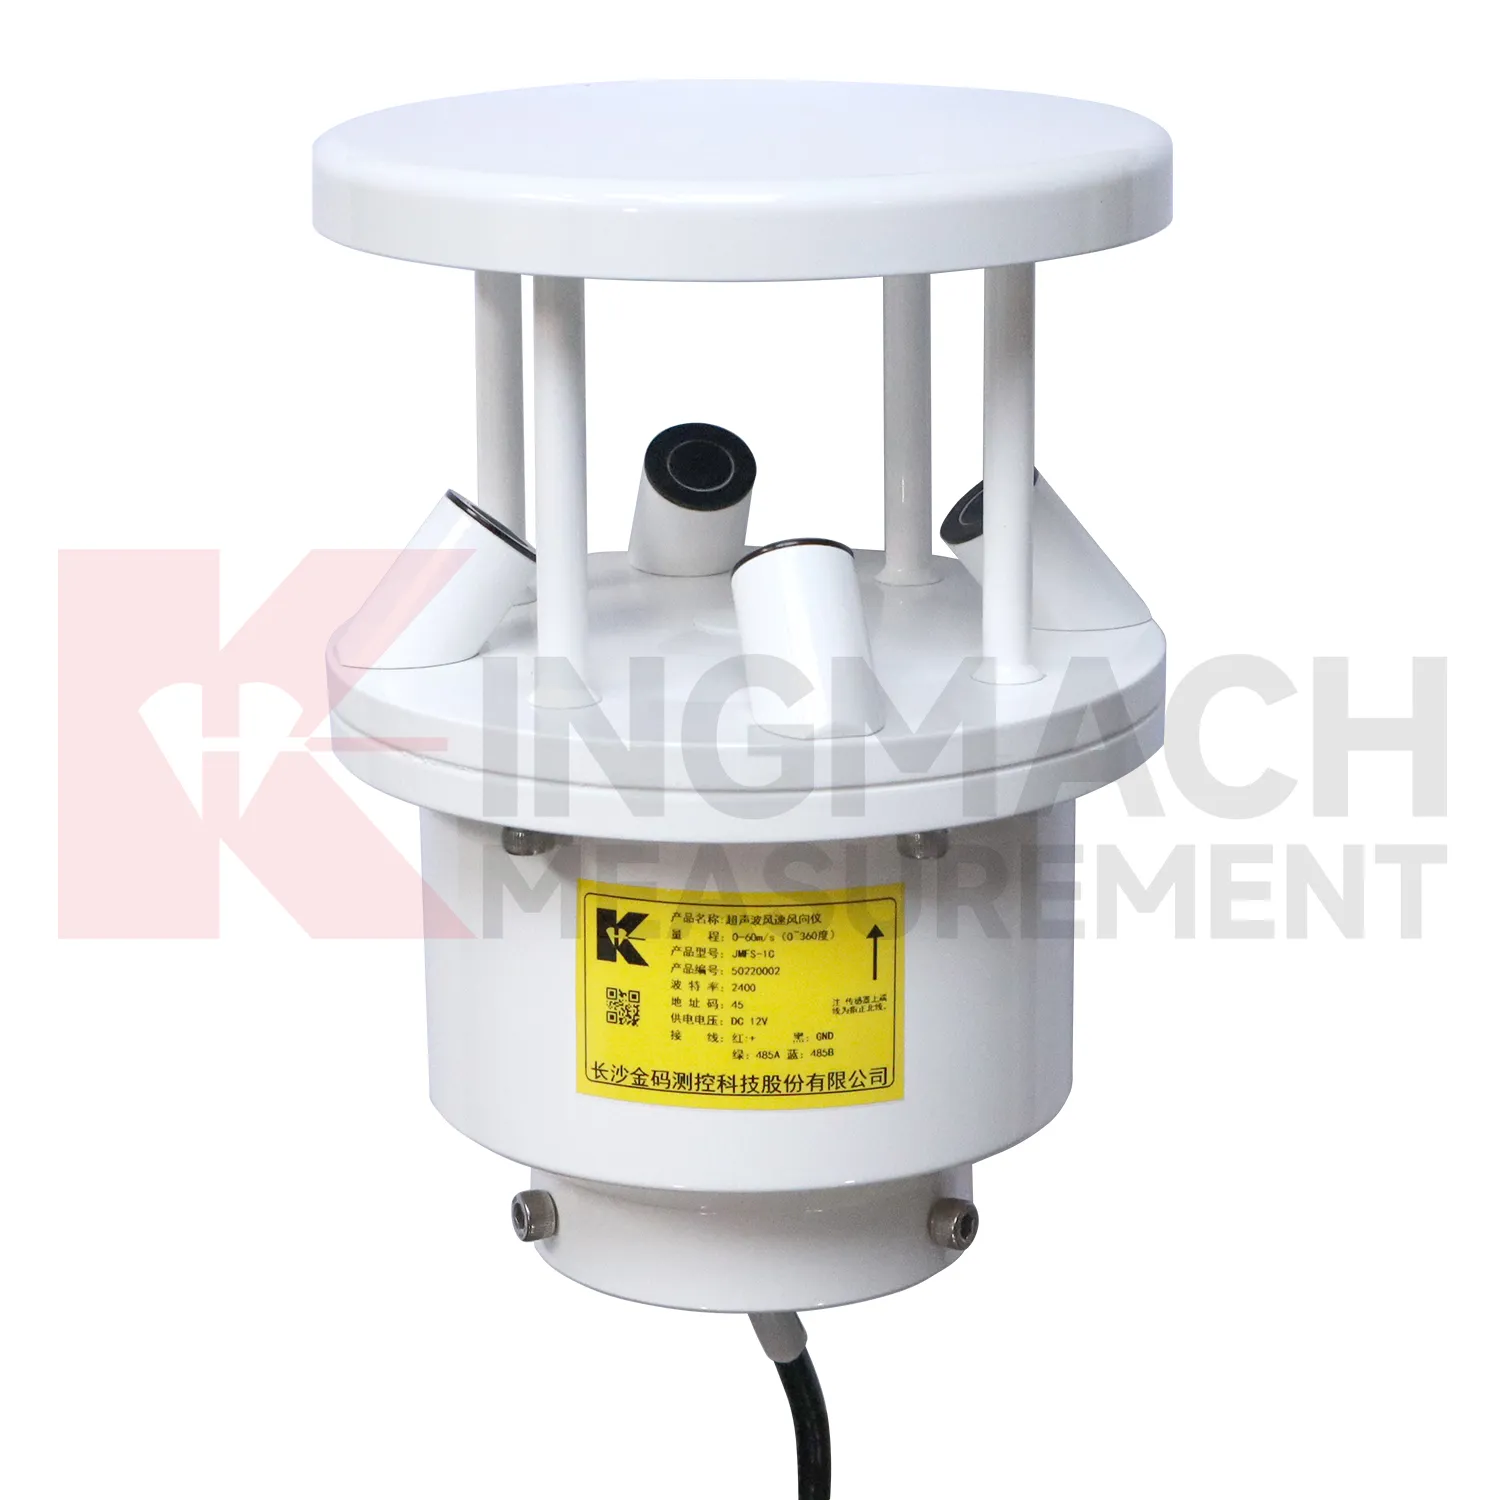
Q: How does wind data support bridge or tower monitoring?
A: Wind direction and exposure can explain vibration, deflection, access difficulty, and weather-driven structural response.
Q: Why monitor humidity underground?
A: Humidity can affect cabinets, connectors, corrosion, sensor stability, and operating conditions in tunnels, subways, mines, and equipment spaces.
Q: How does temperature help interpretation?
A: Temperature helps reviewers separate thermal behavior from structural change in strain, displacement, cabinet condition, or material response.
Long-term value comes from consistency. A channel that keeps the same location, unit, maintenance history, and linked asset record can support seasonal comparison, post-storm review, and handover between construction and operation teams.
Reviews
Michael Anderson
The strain gauges and load cells are extremely accurate and stable. They performed very well in our bridge monitoring project. Highly recommended!
James Thompson
The tiltmeters and accelerometers are very sensitive and provide precise data. Perfect for our structural health monitoring system.
Latest Inquiries
To protect the privacy of our buyers, only public service email domains like Gmail, Yahoo, and MSN will be displayed. Additionally, only a limited portion of the inquiry content will be shown.
Olivia***@gmail.comUnited States
Hello, we are currently sourcing high-precision strain gauges and load cells for a bridge monitoring...
Mia***@gmail.comNetherlands
Dear team, we are interested in your readouts & data loggers compatible with multiple sensors. Do yo...
Related product categories
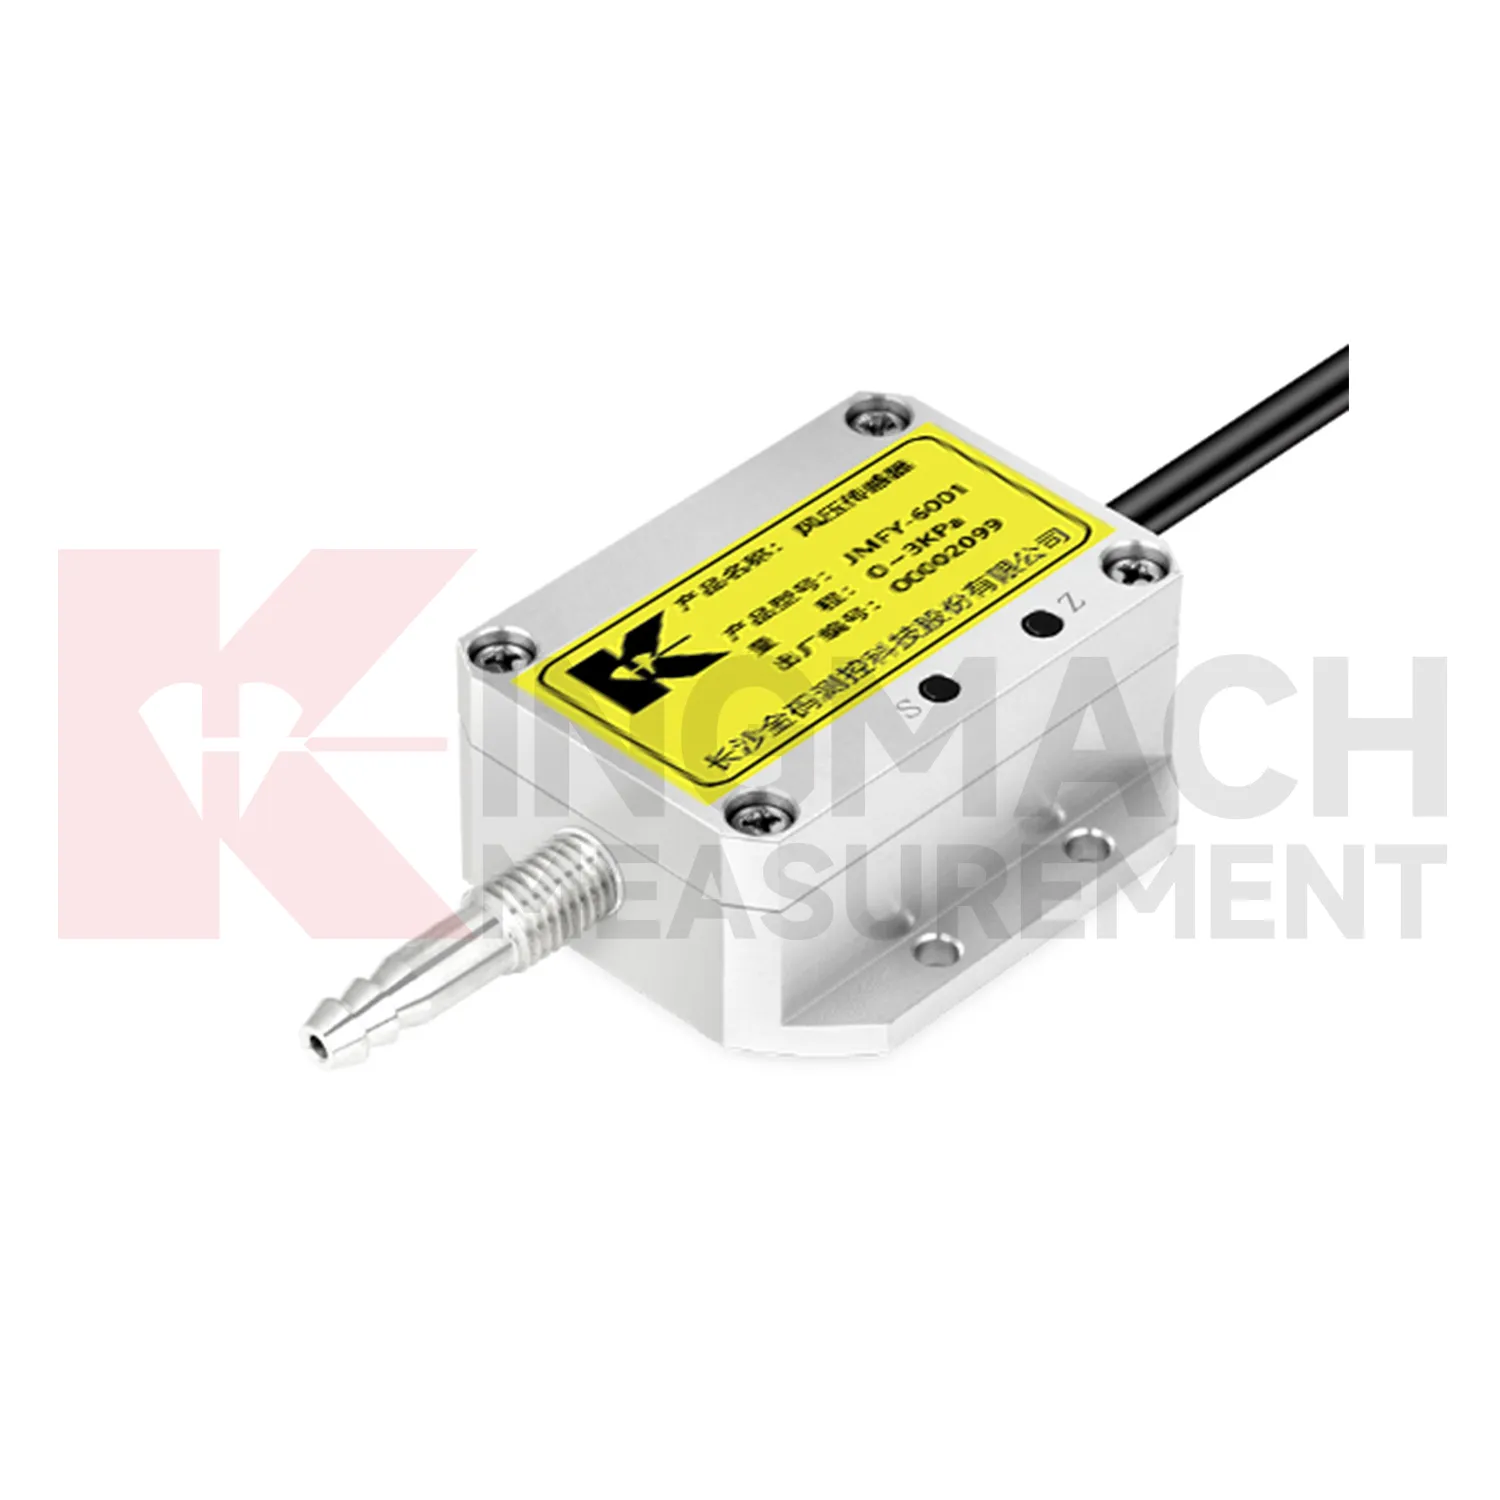
- wind pressure sensor
- ultrasonic wind speed and direction sensor
- wind speed and direction sensor
- wind speed and wind direction sensor
- wind speed and direct sensor
- wireless wind speed and direction sensor
- wind direction and speed sensor
- wind speed and direction sensors
- tipping bucket rain gauge
- tipping bucket rain gauge resolution 0.2 mm standard
- tipping bucket rain gauges
- tipping bucket rain gauge resolution 0.1 mm 0.2 mm standard