
 EN
EN
 ar
ar bg
bg hr
hr cs
cs da
da nl
nl fi
fi fr
fr de
de el
el hi
hi it
it ko
ko no
no pl
pl pt
pt ro
ro ru
ru es
es sv
sv tl
tl iw
iw id
id lv
lv lt
lt sr
sr sk
sk sl
sl uk
uk vi
vi et
et hu
hu th
th tr
tr fa
fa ms
ms hy
hy ka
ka ur
ur bn
bn mn
mn ta
ta kk
kk uz
uz ku
ku
resistance temperature sensors
Wind monitoring in Kingmach resistance temperature sensors helps explain dynamic response and site exposure on bridges, towers, airports, marine facilities, tunnel portals, urban stations, and wind-sensitive construction areas. Wind values are most useful when the station placement represents the asset being reviewed. A sensor behind a wall or below a sheltered deck may produce neat data but fail to explain the structure. Engineers often need to know direction as well as speed because crosswind, headwind, gusts, and local shielding create different responses. Wind records should be reviewed with vibration, tilt, strain, displacement, pressure, access restrictions, and inspection timing. In exposed environments, maintenance teams also need to understand whether ice, salt, dust, or lightning may have affected the station. The environmental record becomes stronger when it shows both the weather condition and the reliability of the measurement point.
The environmental point should be part of a named monitoring question. It may explain wetting, drying, wind exposure, thermal movement, cabinet stress, or pressure variation, but that purpose needs to be visible in drawings and reports.
If the reading seems unusual, the team should check the physical condition of the station before drawing conclusions about the asset. Blockage, poor exposure, loose wiring, water entry, and changed surroundings can all create misleading patterns.
A practical report links the condition value with time, place, and action. It should help a reviewer decide whether to keep observing, inspect the field point, compare nearby instruments, or record the event as normal site behavior.
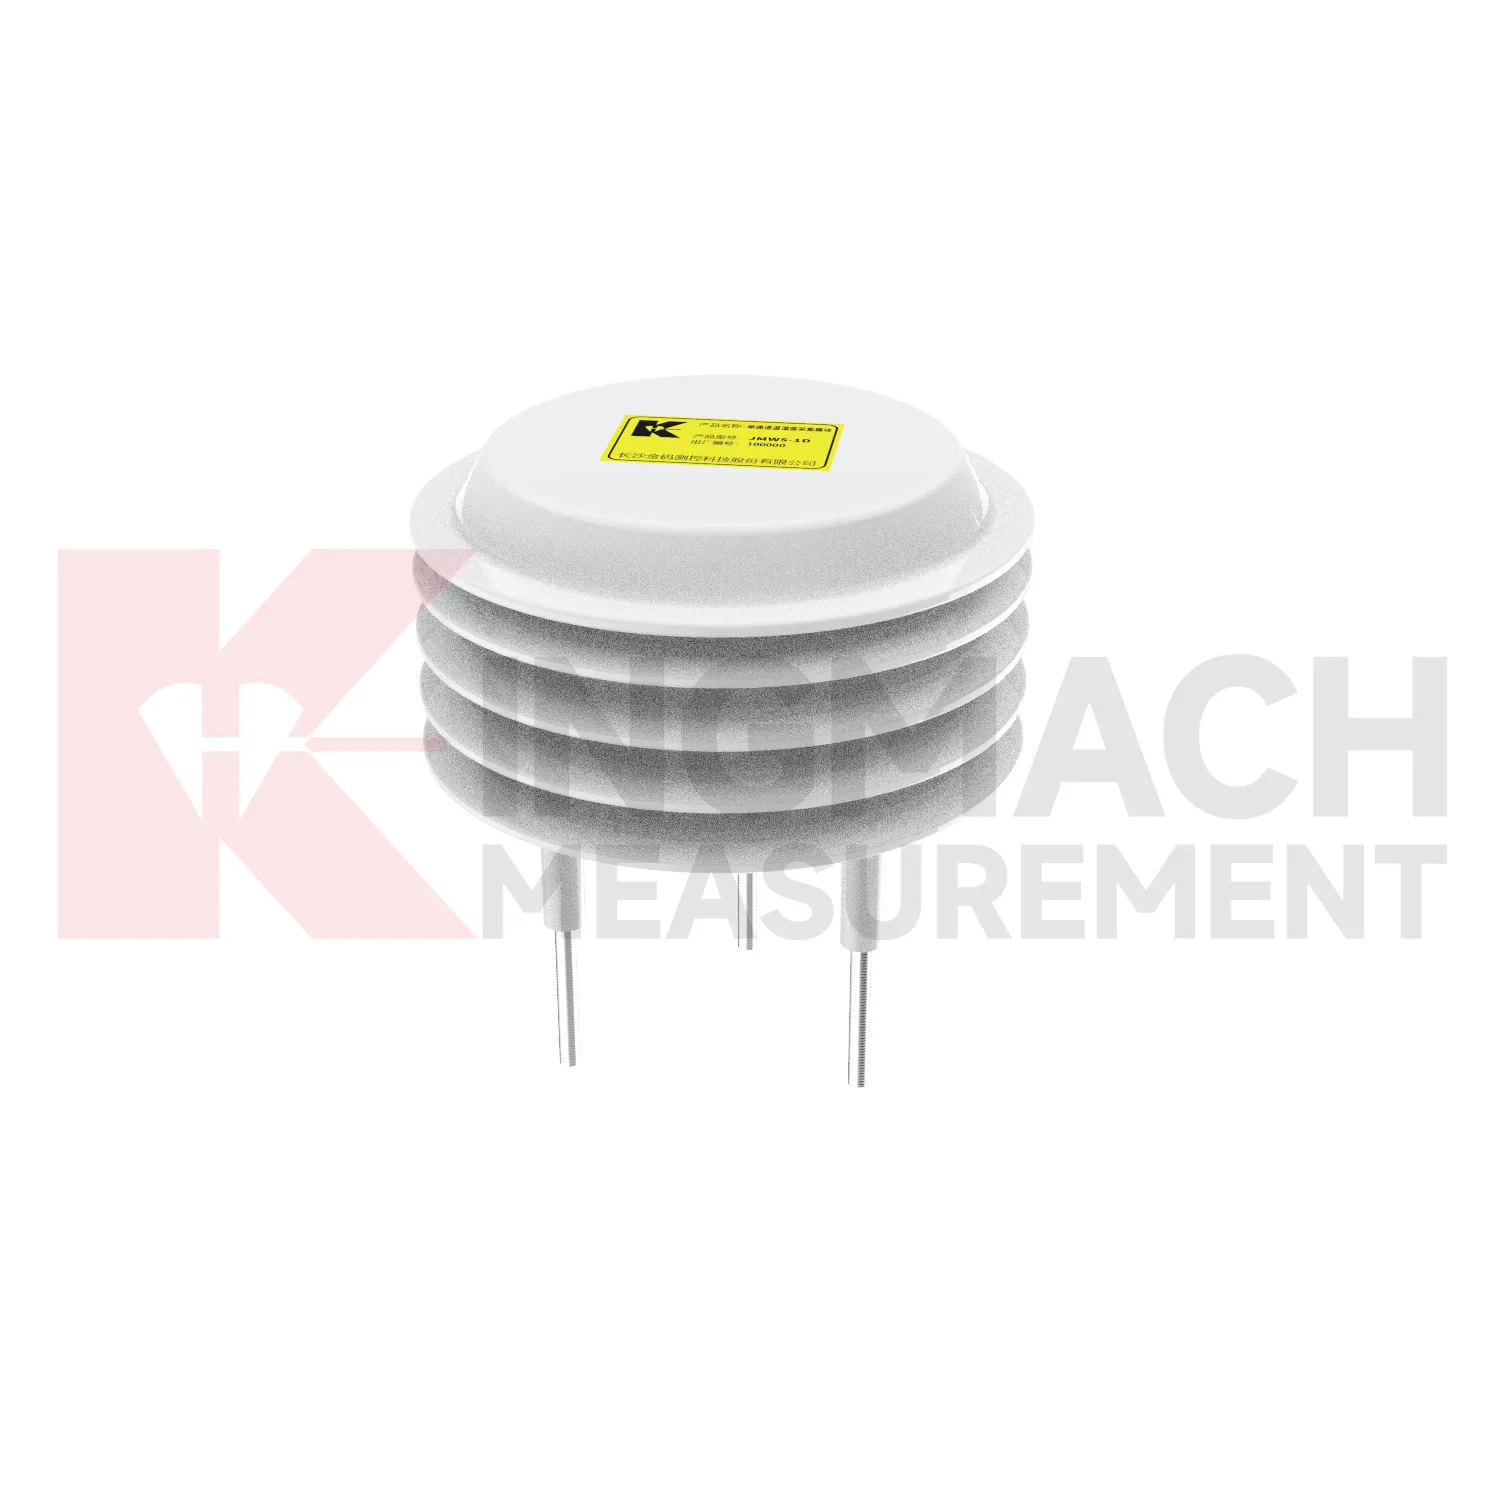
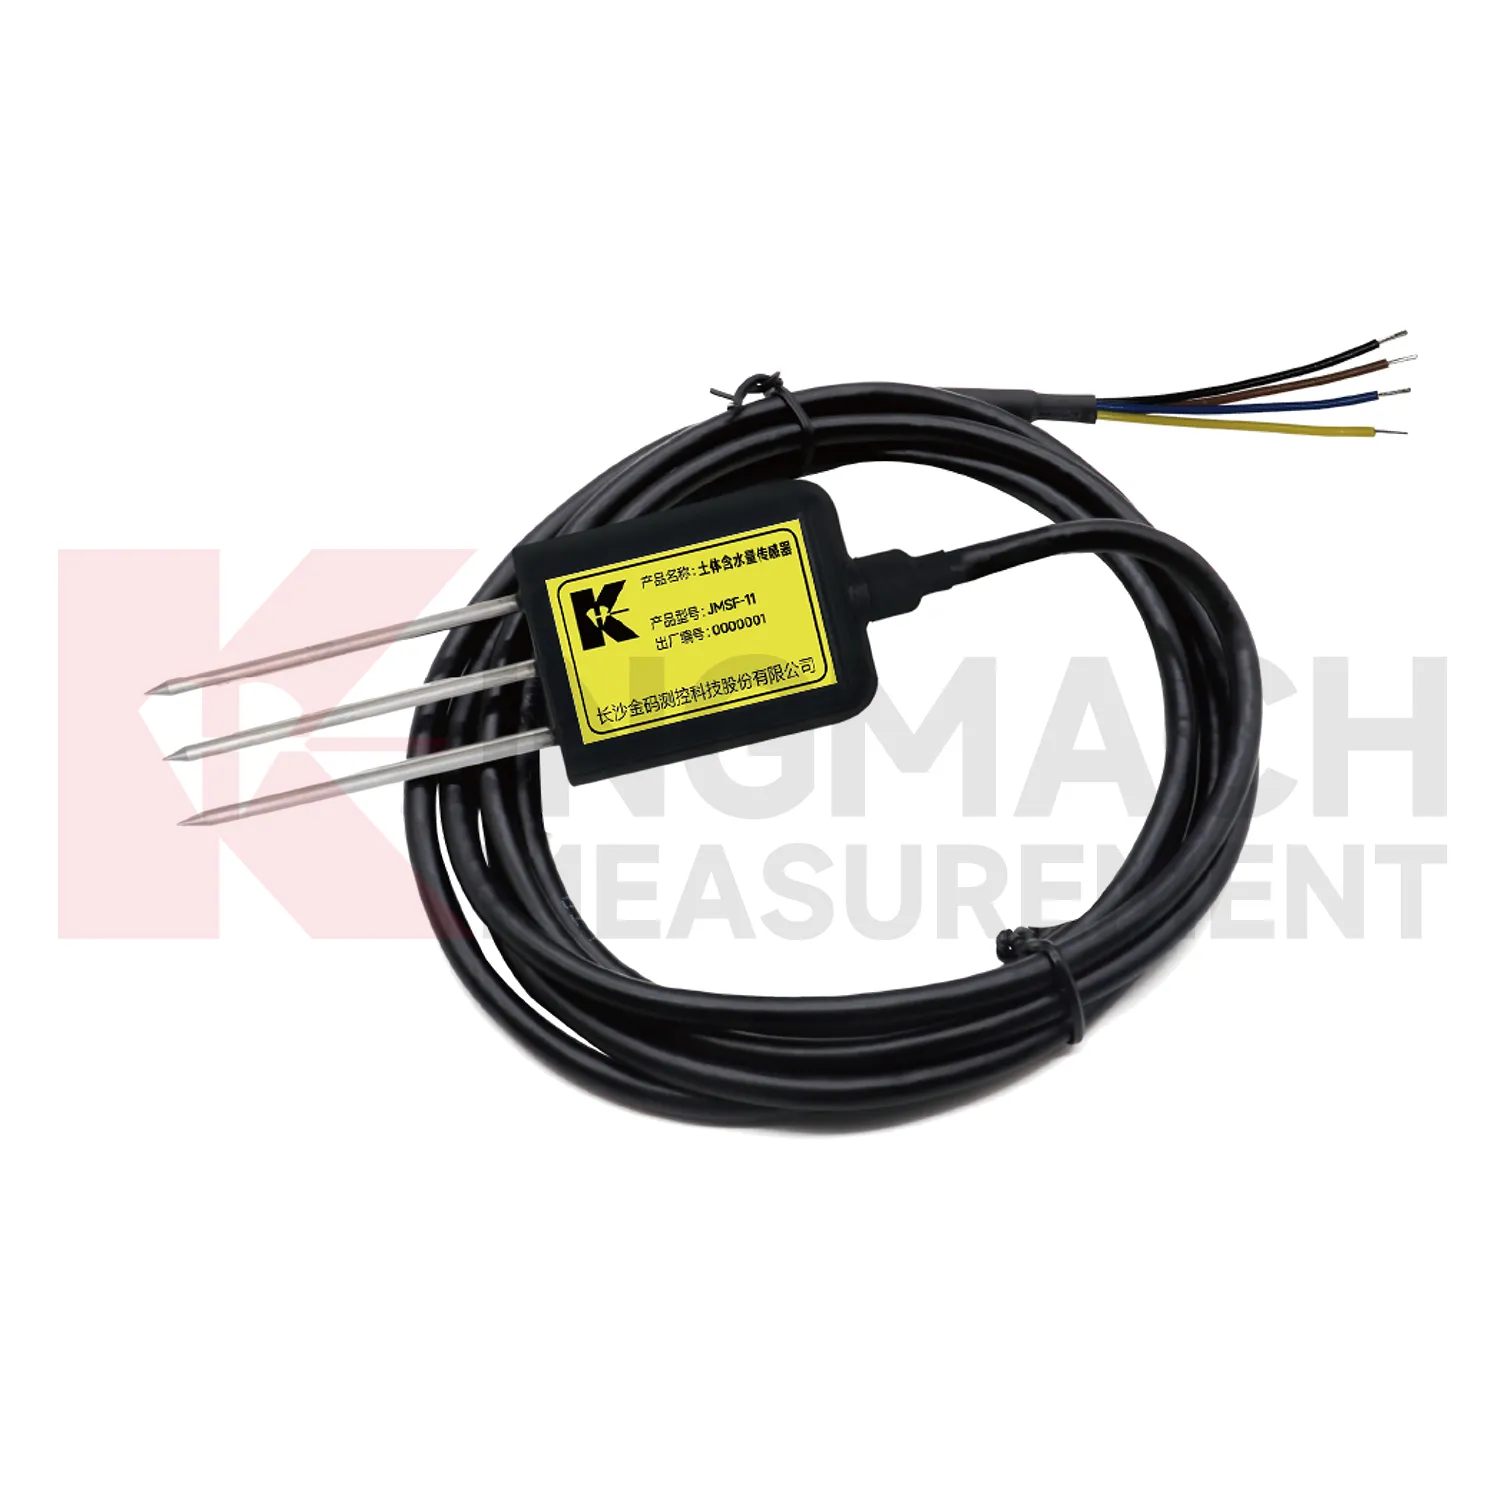
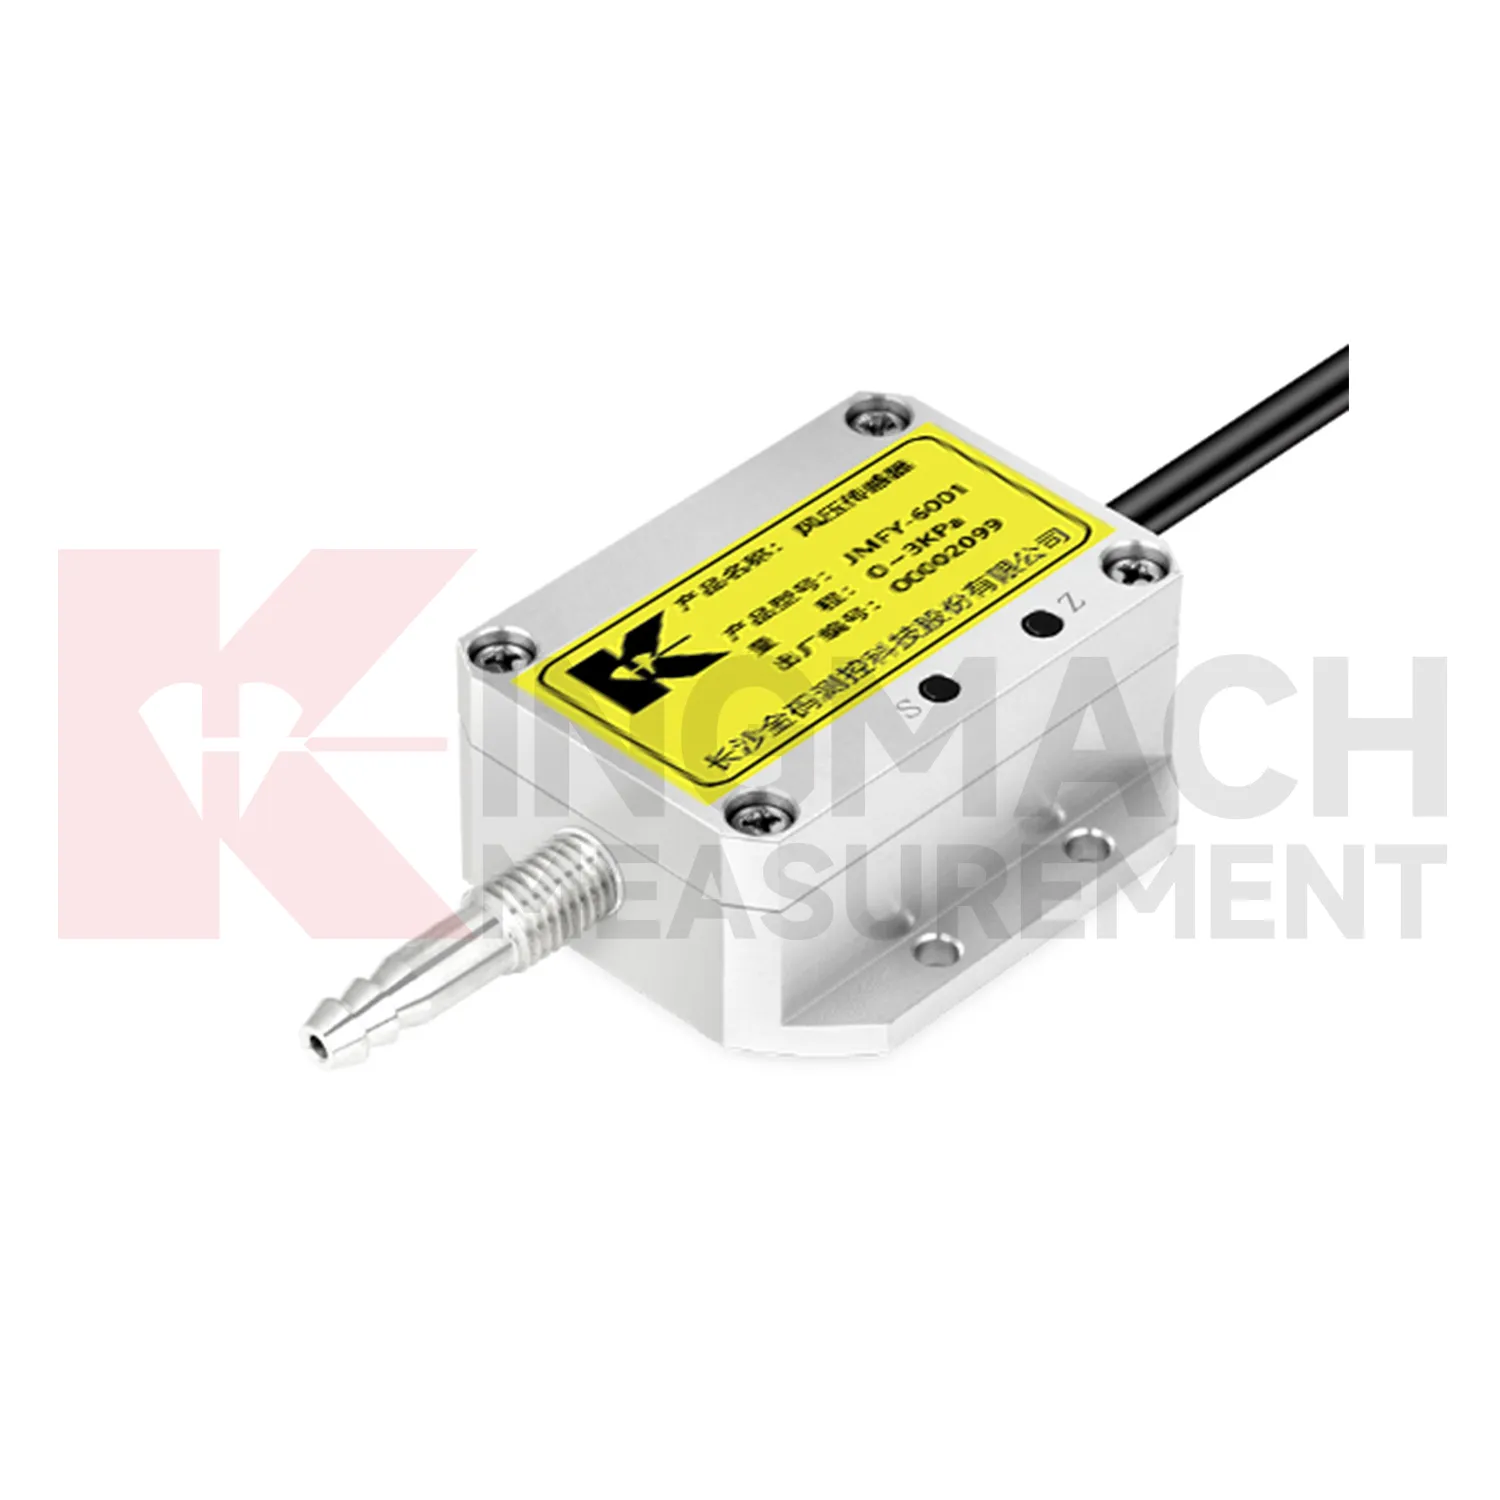
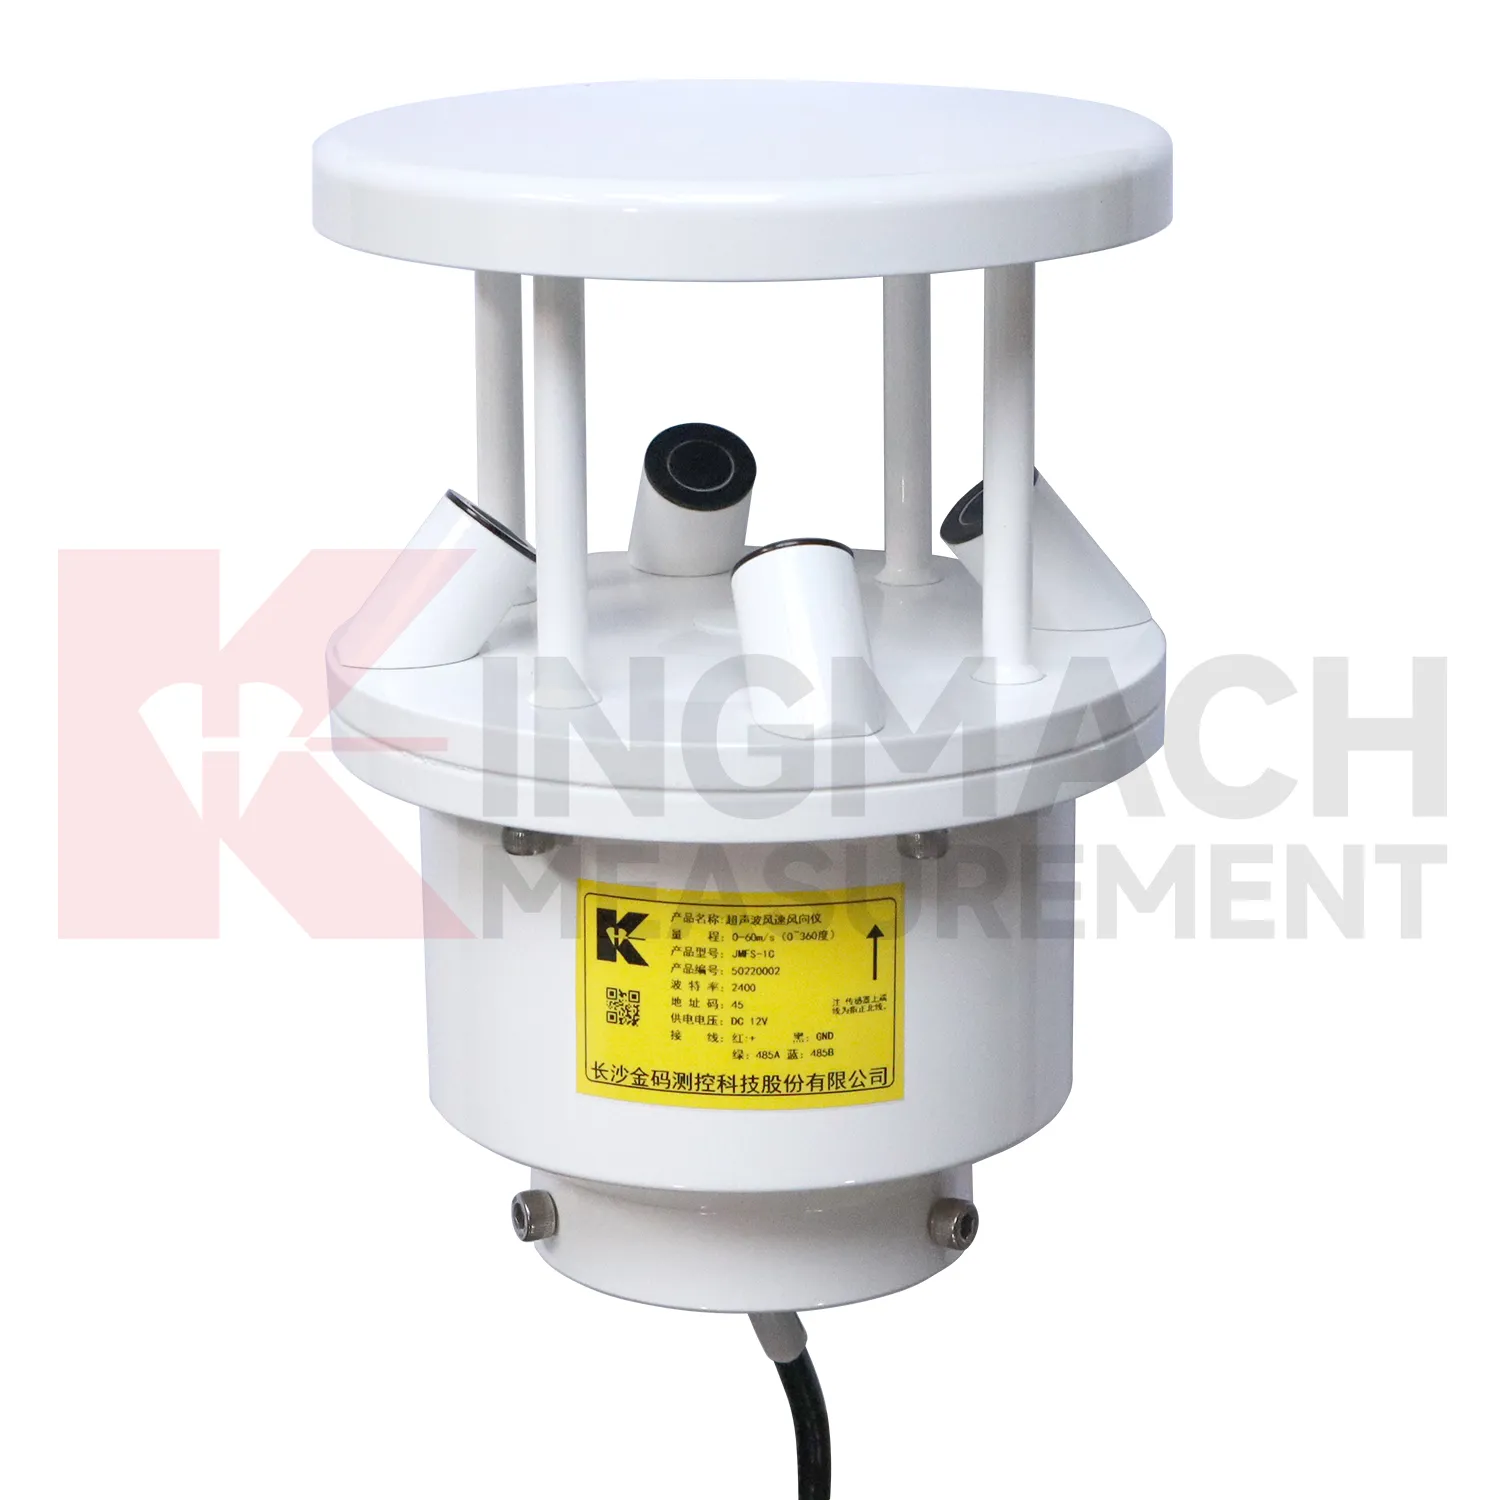
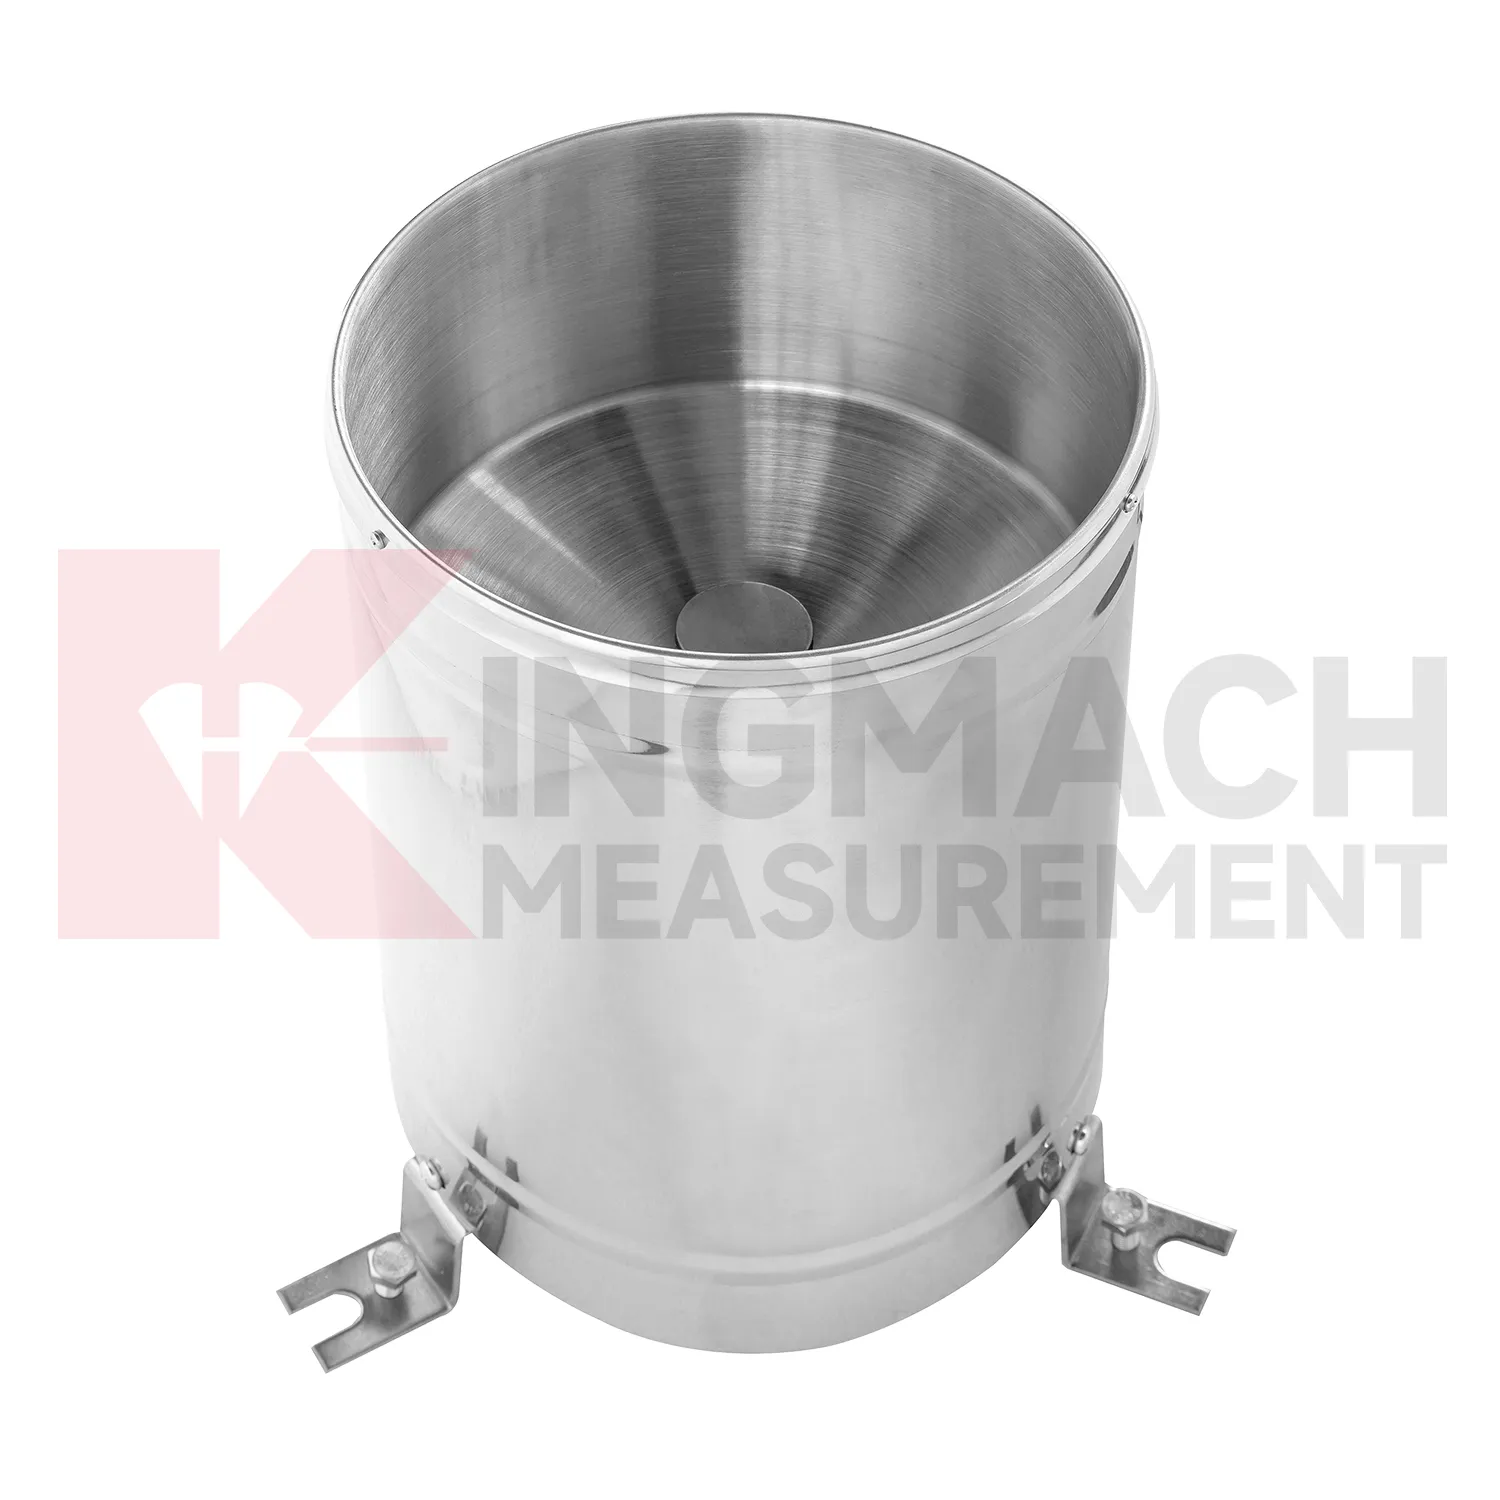
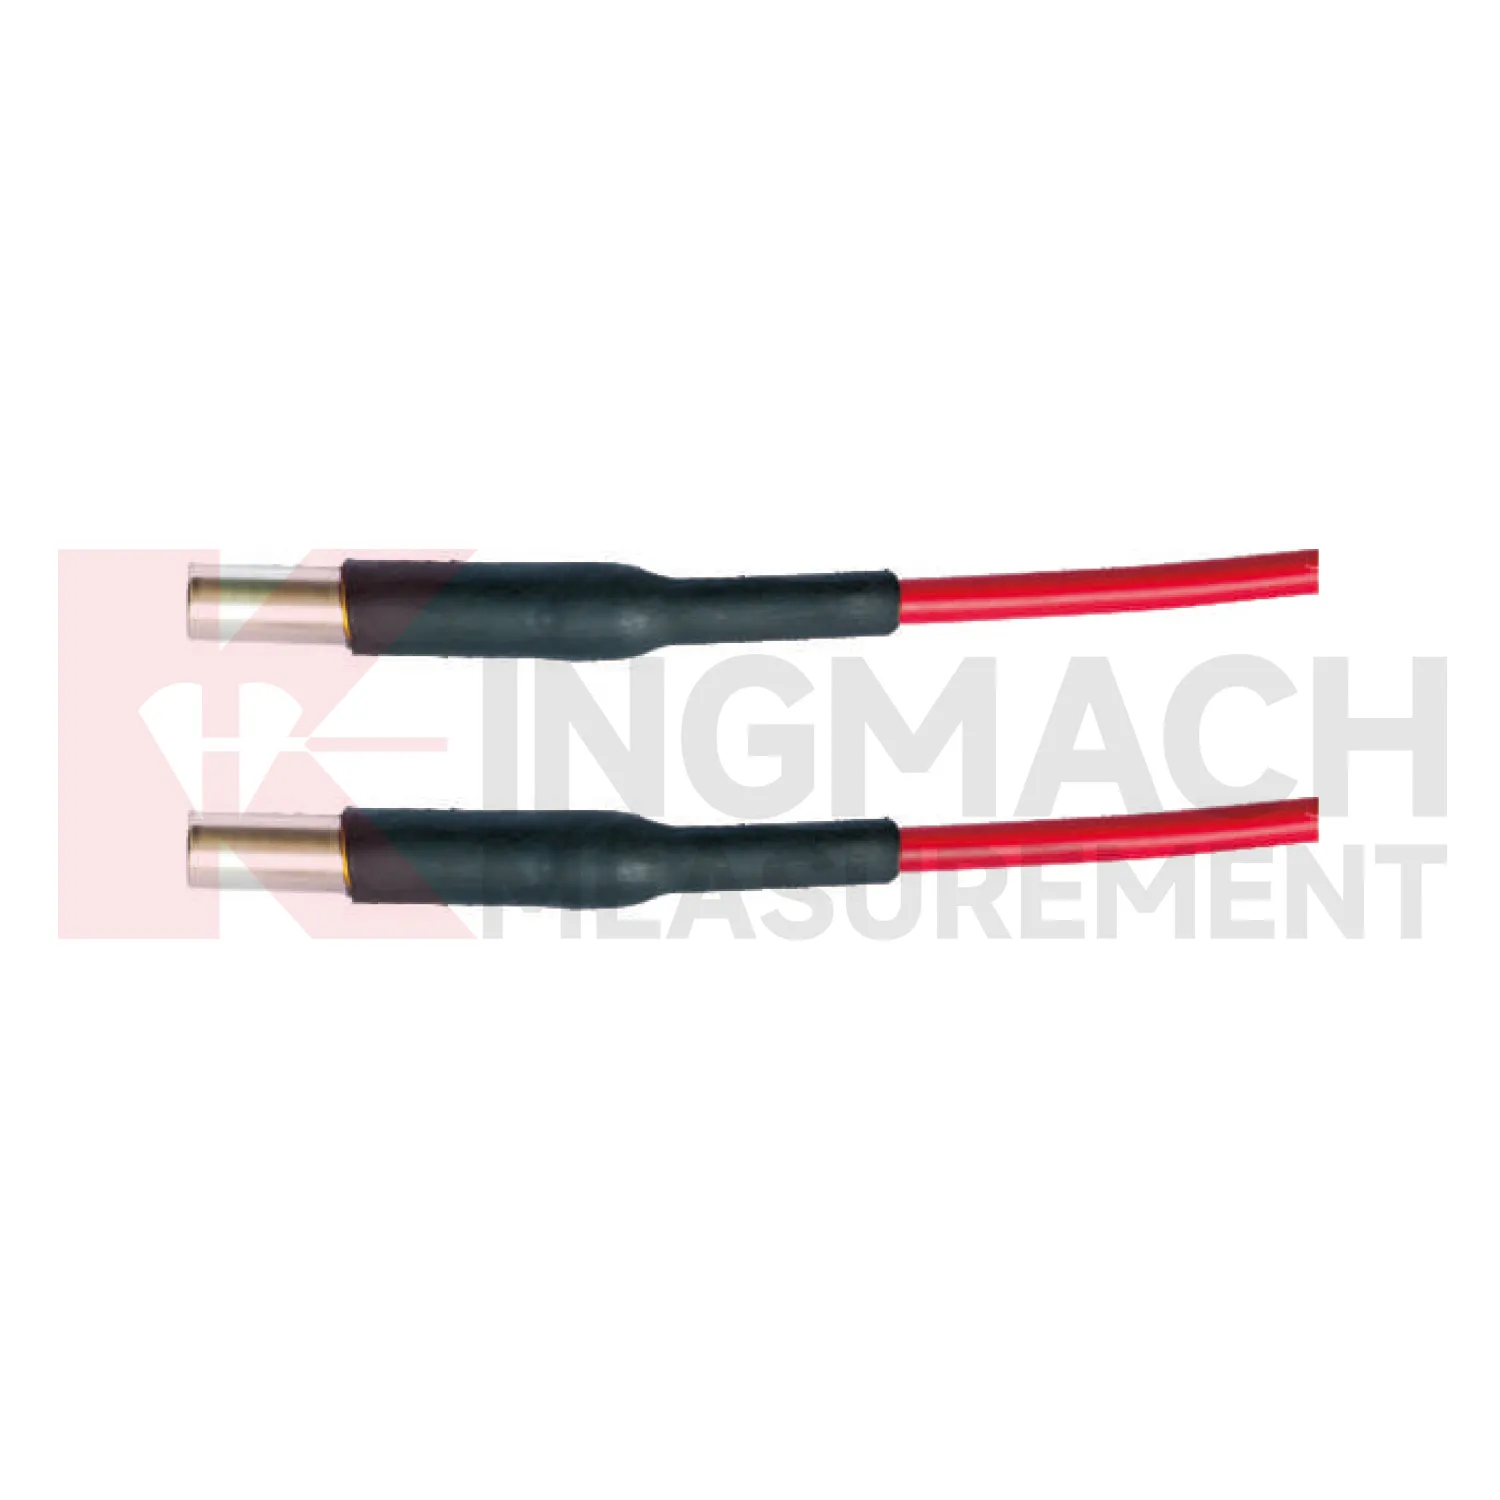
Application of resistance temperature sensors
Tunnel and subway projects use Kingmach resistance temperature sensors to follow underground air conditions, water-related changes, and equipment environments. Temperature and humidity can affect cabinet reliability, corrosion risk, sensor stability, and worker comfort. Rainfall outside a portal may relate to seepage or slope movement near entrances. Airflow or pressure differences can matter in shafts, stations, equipment rooms, and construction zones. Environmental readings should be reviewed with settlement, convergence, displacement, crack records, water-level observations, and maintenance notes. Point naming is especially important underground because many sections look similar after construction. A useful record includes chainage, side, elevation, equipment area, and sensor purpose. When a fault, leak, or deformation appears, environmental data helps the team understand whether the change followed weather, ventilation, construction, or equipment operation.
Underground maintenance teams also need environmental records that point to access reality. A damp equipment room, a warm cabinet zone, a portal affected by rain, and a ventilated platform area may all belong to the same project but require different responses. The report should keep these areas separate.
For handover, tunnel records should preserve section drawings, cabinet names, drainage notes, ventilation changes, and photographs after installation. This helps future teams know whether a humidity or temperature change came from site operation, water entry, seasonal weather, or equipment relocation.
The future of resistance temperature sensors
The future of Kingmach resistance temperature sensors will focus on linking environmental triggers directly to structural behavior. Owners do not only need to know that rain fell, wind rose, or humidity changed. They need to know whether those conditions explain movement, strain, vibration, seepage, or equipment faults. Future monitoring reports should place condition curves and structural curves on the same timeline with inspection notes. That will make it easier to distinguish weather-driven behavior from progressive deterioration. The practical improvement is not more scattered data; it is clearer relationships. When environmental records are connected to the assets they affect, engineers can review alarms faster and plan field checks with better evidence.
This direction will also change how warning levels are written. A slope warning may depend on rainfall history and wetting trend, while a bridge warning may depend on wind period and structural response. Future systems should allow these links to be visible instead of forcing every channel into one isolated threshold.
For owners, the benefit is a shorter path from alarm to action. A reviewer can see the condition that changed, the asset that reacted, the inspection that followed, and whether the response returned to normal. That is more useful than separate charts that require manual reconstruction.
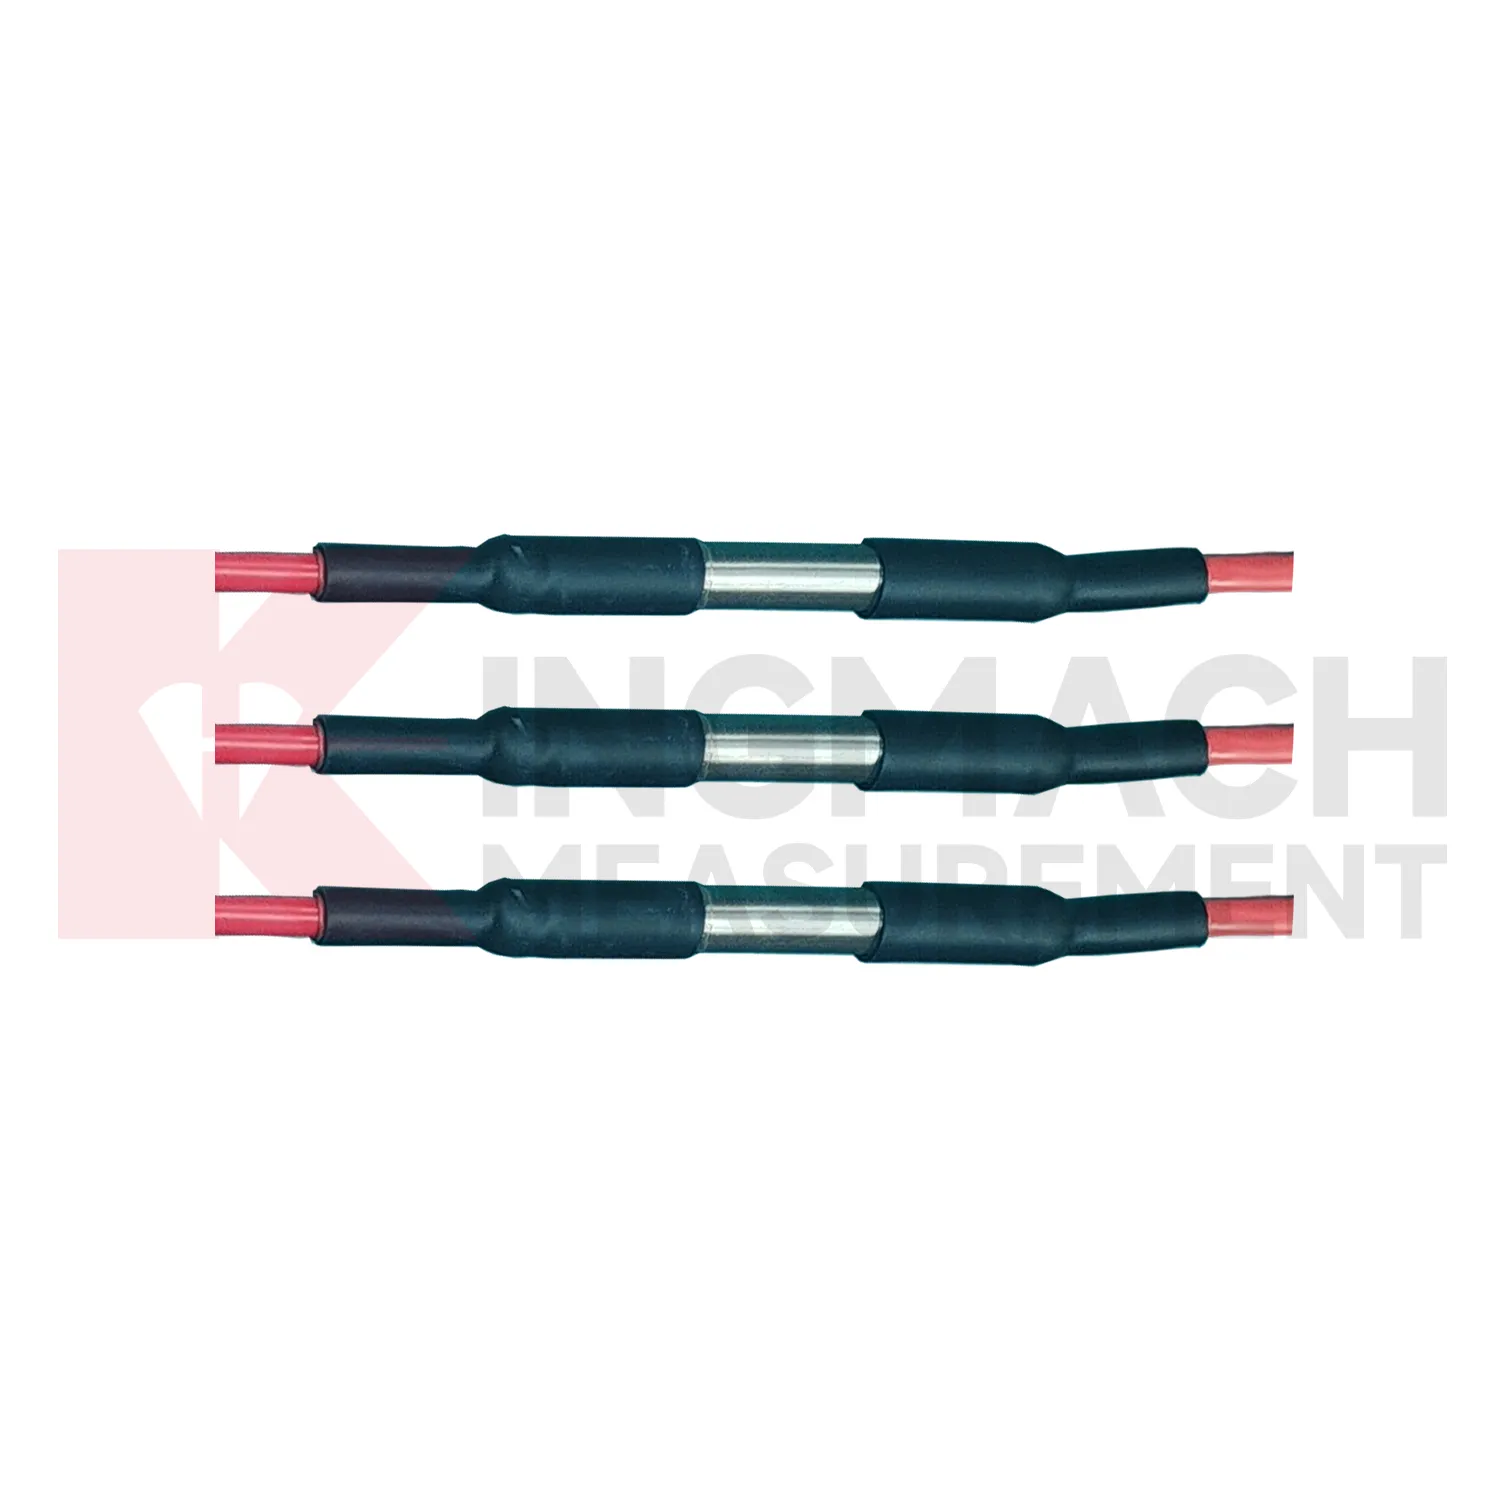
Care & Maintenance of resistance temperature sensors
Care and maintenance of Kingmach resistance temperature sensors should begin with placement checks. A station can be technically healthy and still produce poor data if it is installed in the wrong place. Rain points need open sky and level mounting. Wind points need representative airflow. Soil points need firm contact at the intended depth. Humidity points need to reflect the room, tunnel, cabinet, or work zone being monitored. Pressure points need clean and sealed paths. Maintenance staff should record location, mounting height, exposure, cable route, and any nearby site change. If a wall, roof, new machine, temporary shelter, or excavation appears near the point, the data may change even though the sensor has not failed.
During abnormal events, the first question is not only whether the value crossed a limit. The reviewer should ask what changed around the site, whether the related structure reacted, and whether a field inspection confirmed the same pattern.
Long-term value comes from consistency. A channel that keeps the same location, unit, maintenance history, and linked asset record can support seasonal comparison, post-storm review, and handover between construction and operation teams.
Kingmach resistance temperature sensors
A strong Kingmach resistance temperature sensors plan keeps the writing and the system focused on site conditions rather than product lists. The page should help a reader understand how weather, moisture, pressure, temperature, and humidity affect the assets they are responsible for. It should explain how environmental readings support slope review, bridge response, tunnel operation, dam inspection, irrigation control, construction records, and long-term maintenance. It should not read like a catalog of devices or a compressed specification table. The buyer needs a monitoring approach that connects field conditions with engineering decisions. That approach is what makes environmental data worth collecting over months and years.
Maintenance teams should record cleaning, access difficulty, enclosure condition, cable repair, vegetation growth, nearby equipment changes, and the first normal reading after work. Those notes protect the meaning of the curve when old data is reviewed months later.
The environmental point should be part of a named monitoring question. It may explain wetting, drying, wind exposure, thermal movement, cabinet stress, or pressure variation, but that purpose needs to be visible in drawings and reports.
FAQ
Q: Where should a rain point be placed?
A: It should be level, open to the sky, and away from obstructions, splash sources, roof edges, and debris-prone areas.
Q: Where should wind be measured?
A: Wind should be measured where airflow represents the asset or work area being reviewed, not behind a wall or sheltered obstruction.
Q: How should soil points be installed?
A: They should have firm contact with the surrounding soil, a recorded depth, protected cable route, and a stable first value.
Q: What should commissioning records include?
A: Include point location, measured condition, unit, mounting photo, cable route, power source, data channel, and linked structural record.
Q: Why are photos useful?
A: Photos help future reviewers understand exposure, mounting, cable routing, and whether later site changes affected readings.
Maintenance teams should record cleaning, access difficulty, enclosure condition, cable repair, vegetation growth, nearby equipment changes, and the first normal reading after work. Those notes protect the meaning of the curve when old data is reviewed months later.
Reviews
David Wilson
We purchased displacement transducers and settlement sensors, and the quality exceeded our expectations. Easy installation and reliable performance.
Ryan Lewis
Fast delivery and excellent product quality. The accelerometers and tiltmeters are highly reliable. Strongly recommend this company.
Latest Inquiries
To protect the privacy of our buyers, only public service email domains like Gmail, Yahoo, and MSN will be displayed. Additionally, only a limited portion of the inquiry content will be shown.
Evelyn***@gmail.comSouth Africa
Hi, we are a contractor working on tunnel construction and need settlement sensors and displacement ...
Mia***@gmail.comNetherlands
Dear team, we are interested in your readouts & data loggers compatible with multiple sensors. Do yo...
Related product categories
- semiconductor based temperature sensor
- semiconductor based ic temperature sensor
- semiconductor-based temperature sensors
- resistance temperature detector sensor
- resistive temperature sensor
- resistance temperature sensor
- platinum resistance temperature sensor
- resistive temperature sensors
- resistance type temperature sensors
- resistance temperature sensors
- temperature sensor resistance
- ambient temperature sensor resistance